Takeaways
- Our last piece argued that the new Land Sector and Removals Standard filled a critical gap in carbon accounting. This one applies the new methodology and looks at how our process stacks up.
- Savor's process cuts the climate footprint of fats and oils by roughly 50–98%, depending on which fats we're displacing and how we source carbon and energy—and it does so across every major category, not just the easy ones.
- Those advantages have been independently verified for our first product in a third-party, ISO-certified life cycle assessment.
The short version
I recently wrote about why the world needed a carbon land standard: leave land out of your carbon math, and you get perverse outcomes—“low-carbon” fuels that decimated rainforests and sourcing decisions grounded in how long land has been degraded rather than ecosystem potential. In that installment, we showed how GHG Protocol’s new Land Sector and Removals Standard (the “Carbon Land Standard”) finally closes that gap.
Now it’s time to ask what that framework says about us.
Savor makes fats and oils directly from simple sources of carbon, hydrogen, and oxygen instead of farmland—no crops, no animals, no fields. We’ve run the numbers, and our process cuts the climate footprint of fats and oils by 50 to 98%, depending on the carbon intensity of the fat or oil we’re substituting as well as the process scenario we’re modeling. Using methane as our carbon source on today’s US grid mix results in a roughly 50% emissions reduction compared with palm oil—the most land-efficient oil crop in agriculture—or over 70% reduction compared with milkfat. To approach a zero-emission footprint, we can source our carbon from captured CO2 on an entirely decarbonized grid. Unlike a crop whose footprint is largely fixed by biology and geography, our footprint will continue to approach this minimum as our efficiency improves with scale-up and the grid decarbonizes.
We didn't want you to take our word for any of this, so we completed an independent audit of the life cycle assessment (LCA) of our first commercial product—alternative milkfat. The third-party, ISO-certified LCA found Savor's process dramatically reduces greenhouse gas emissions (>80%), land use (>800x), and water use (>10x) versus conventional milkfat. If you make it down to the weeds, you’ll see that this assessment was completed before the new Carbon Land Standard was published, so land use emissions were explicitly left out of this first third-party analysis—in the sections below, we’ll show how the picture becomes even more stark when they’re included.
Where we left off
The short recap, for anyone who didn't read the first piece (and a refresher for anyone who did):
Carbon accounting spent decades tracking only fluxes—what you emit in a year—while ignoring stores: the carbon a piece of land could hold. That accounting oversight has hidden the true climate impact of agricultural products for decades. The fix is to get land on the carbon accounting books in two ways: the emissions from clearing it (direct land use change, or dLUC–which shows up on the carbon ‘income statement’) and the carbon land could be storing if it weren't in agricultural use (carbon opportunity cost, or COC–which shows up on the carbon ‘balance sheet’).
Applying the new Carbon Land Standard, a clear design brief emerges: the lowest-impact way to make a macronutrient is to produce it at very high yield, on very little land, on ground with little native ecosystem value—ideally all three.
That brief is easy to state and brutally hard to meet, because in agriculture these pull against each other, where the highest-yielding crops consistently grow in places that are home to the richest ecosystems.
So who can satisfy all three conditions at once?
Almost nothing in the current food system can: if your product grows in soil, you're negotiating a trade-off between yield and ecosystem value, and the best you can do is find a favorable point on that curve.
There is, though, one way to step off the trade-off curve entirely: don't use farmland. If you can build a fat molecule from carbon, hydrogen, and oxygen directly, yield stops being a function of soil and sunlight, land use collapses toward zero, and the “native ecosystem value” of your production site becomes almost irrelevant—a facility can sit on land that was never anyone's habitat[1]. That's the profile the updated accounting optimizes towards, and it's one of the many reasons we founded Savor four years ago.
The rest of this piece will cover: what our own analysis shows if we compare Savor’s platform across every fat category, what the independent audit confirmed, and, of course, a trip into the weeds for anyone up for a more nitty-gritty methodology adventure.
Footprint comparison
The primary output of a life cycle carbon assessment is the carbon intensity of a product— how many kg of CO₂e must be emitted to make a kilogram of pure Savor fat? The graph below shows a summary of where Savor fats land based on third-party analysis using production data from our pilot plant today, shown alongside conventional fats and oils.
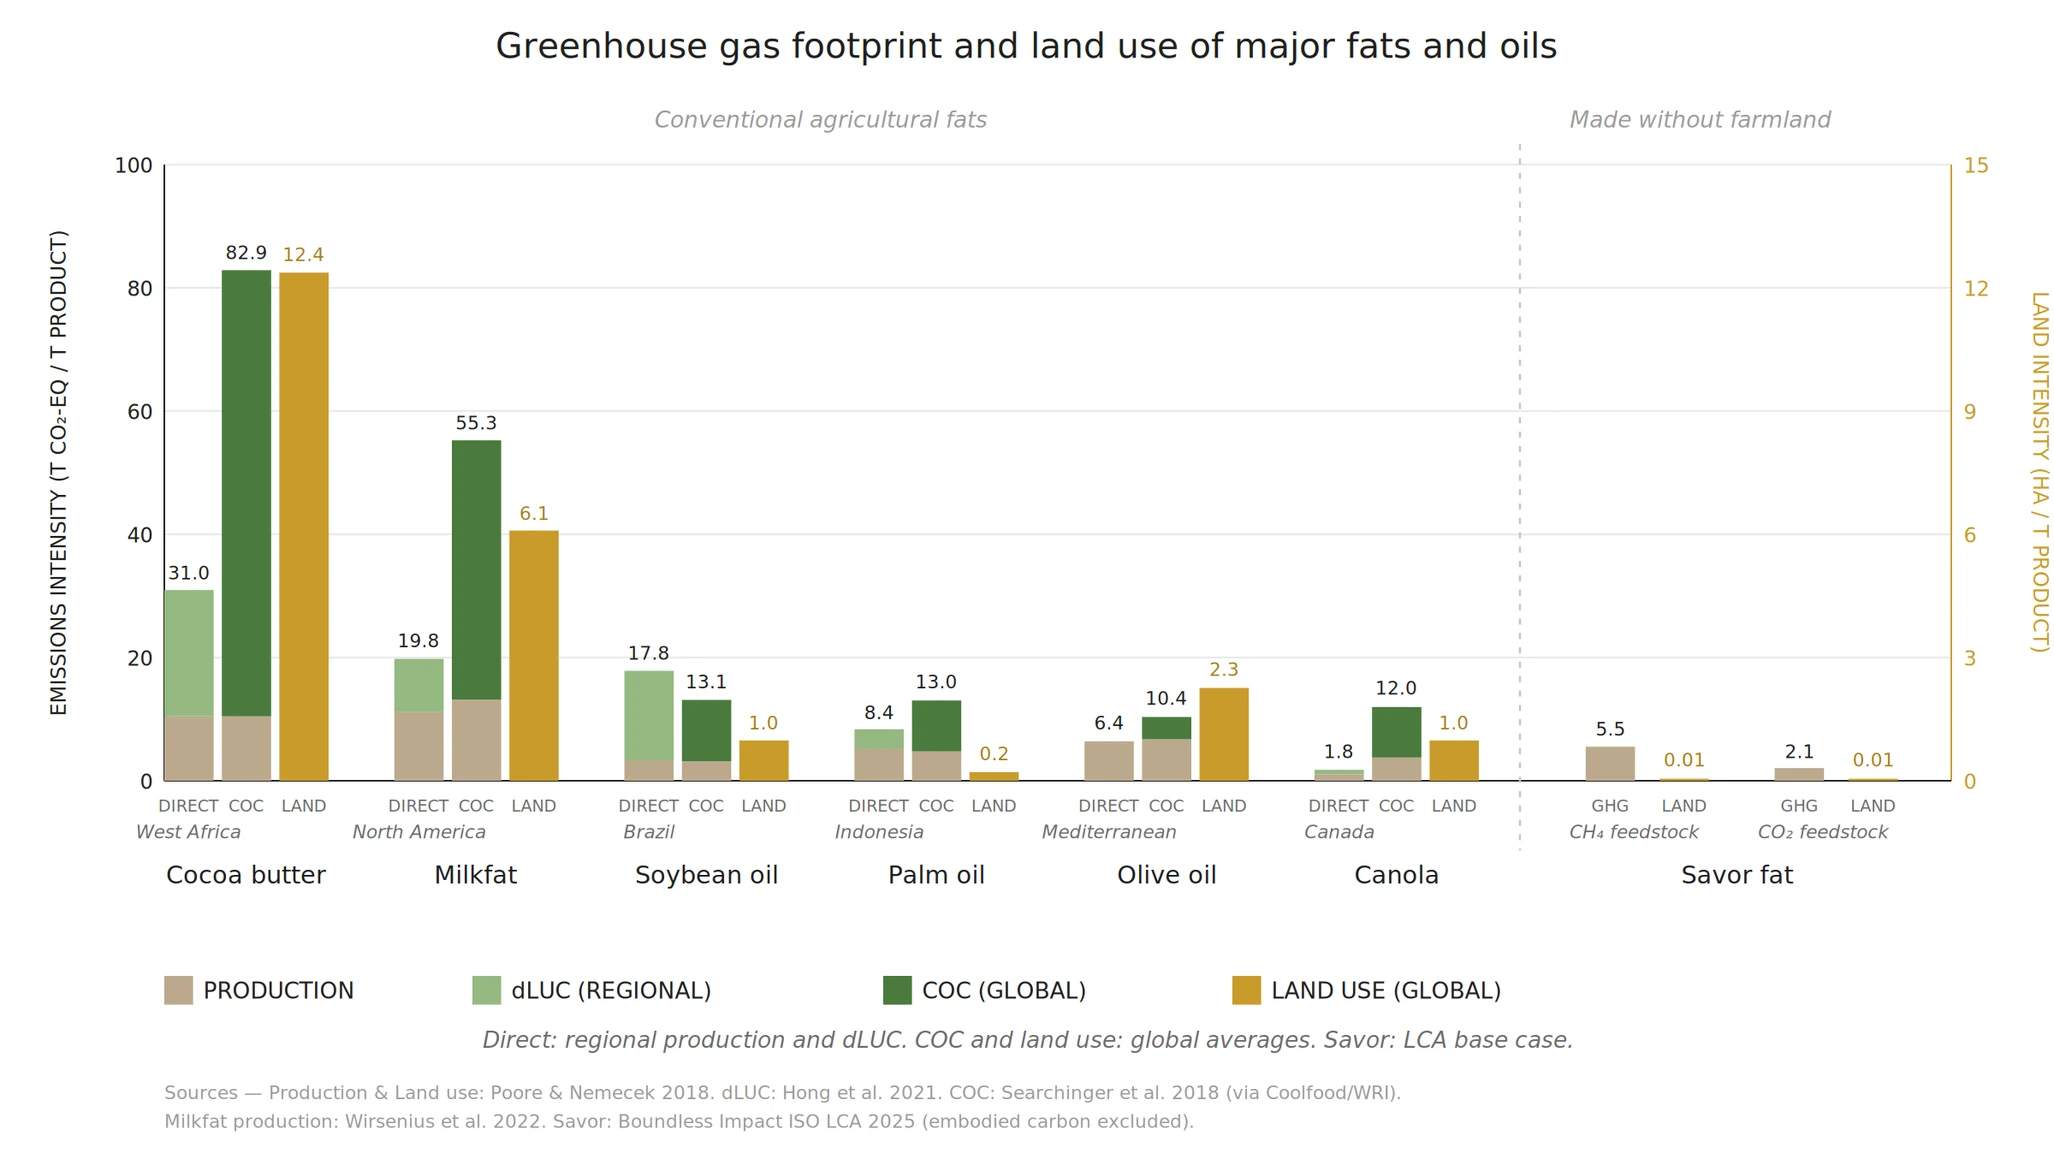
Under today’s conditions and an average US grid mix, a kilogram of Savor fat lands at roughly 2 kg of CO₂e when we source carbon from CO₂, and roughly 5.5 kg when we source it from methane. While the agricultural emissions are driven by fertilizer and land use, Savor’s footprint is driven by: how much energy the process consumes, how clean the energy is that drives the process, and where carbon is sourced. Agricultural fats and oils have a much wider reported range, from 2 to 30 kg CO₂e including direct land-use change emissions.
In the table below, we’ve summarized the carbon intensity reduction that Savor’s products carry compared to conventional fats and oils for both CH4 and CO2-sourced carbon. To illustrate the importance of land-carbon accounting, we present a comparison with production emissions alone in the first column, followed by the total footprint under direct land-use change (dLUC) analysis and carbon opportunity cost (COC) analysis:
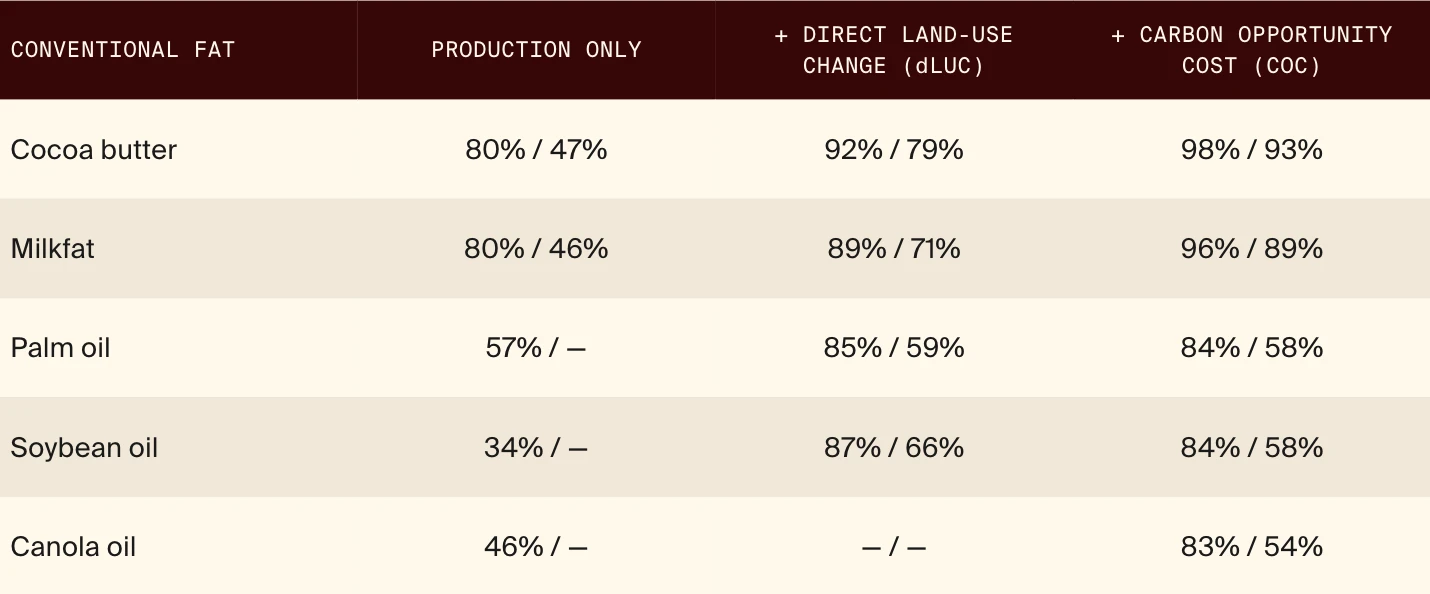
Carbon intensity reduction vs. conventional fats and oils, shown for CO₂-sourced Savor / methane-sourced Savor. Dashes mark cases where Savor doesn't reduce emissions on that basis.
Carbon intensity reduction vs. conventional fats and oils, shown for CO₂-sourced Savor / methane-sourced Savor. Dashes mark cases where Savor doesn't reduce emissions on that basis.
Compared with fats and oils with high land-intensity such as cocoa butter and milkfat, Savor’s products decisively reduce emissions on a production-only basis—even before land use is considered. But compared with oils that are already relatively low-emission—palm, soy, canola—methane-sourced Savor doesn't reduce carbon intensity if only production emissions are considered, and the edge is modest for even CO₂-sourced Savor for these cases.
But production emissions account for less than half of the impact of most fats and oils. When impact is assessed on a COC-basis and the full potential of the carbon that land could be storing is considered, Savor’s low-land use production maps to a dramatic opportunity to reduce emissions across every category. The dLUC assessment shows a similar trend, but with the added nuance typical of dLUC, related to that metric’s dependence on when land was converted to agricultural use.
Taken together, the conclusion is clear: once the full impact of agricultural production and land use is counted, Savor's process cuts carbon intensity by 50–98% on today's average US grid. A critical takeaway from this analysis is the acknowledgement that, because Savor's fats require so little land to produce, their full climate potential isn't realized on production alone—it depends on what happens to the land that's no longer needed: preventing future deforestation, and, ultimately, enabling the active restoration that turns a low-footprint product into a net-positive one. We’ll circle back to scratch the surface on what that looks like quantitatively at the end.
Third-party, ISO-certified assessment
We’ve been analyzing and updating our carbon intensity datasets for both agricultural and Savor fats and oils since before Savor was founded. We even documented our early analyses in a peer-reviewed study published in Nature Sustainability. These early analyses were based on literature data and theoretical models. As we’ve built out and scaled our process, we’ve made direct measurements of the heat and material balance of our process in action. With our own measurements in hand, we contracted a third-party to independently complete a formal lifecycle assessment (LCA) of our products. The data from this third-party assessment was referenced to include Savor’s data in the Footprint comparison above.
The assessment was conducted by Boundless Impact Research & Analytics and conforms to the ISO 14040, 14044, and 14071 standards for life cycle assessments. That last one, 14071, governs comparative assertions meant for public disclosure, and it requires an independent critical review. Three outside experts in life cycle assessment and process modeling—chaired by a professor of civil and environmental engineering—reviewed the calculations, assumptions, and underlying data over two rounds of review. The assessment uses a cradle-to-gate methodology, with a functional unit of one kilogram of fat, and uses ghee as a well-established proxy for anhydrous milk fat where direct dairy data is limited. The formal assessment uses CO2-derived Savor products for its base case due to the availability of an ISO-certified LCA of these raw materials and assumes energy intensity of an average US grid mix. Sensitivity studies across feedstock type and grid mix were analyzed as well—as discussed in our deep dive methodology section. The results of this formal analysis are summarized in the graphs below, in which Savor’s CO2-derived fats and oils are shown to have an 80% lower GHG footprint, 800x lower land footprint, and 10x lower water footprint compared with dairy milkfat. As mentioned above, this third-party analysis was performed prior to GHG Protocol’s new Carbon Land Standard release, so the GHG footprint comparison does not take land-use emissions into account.
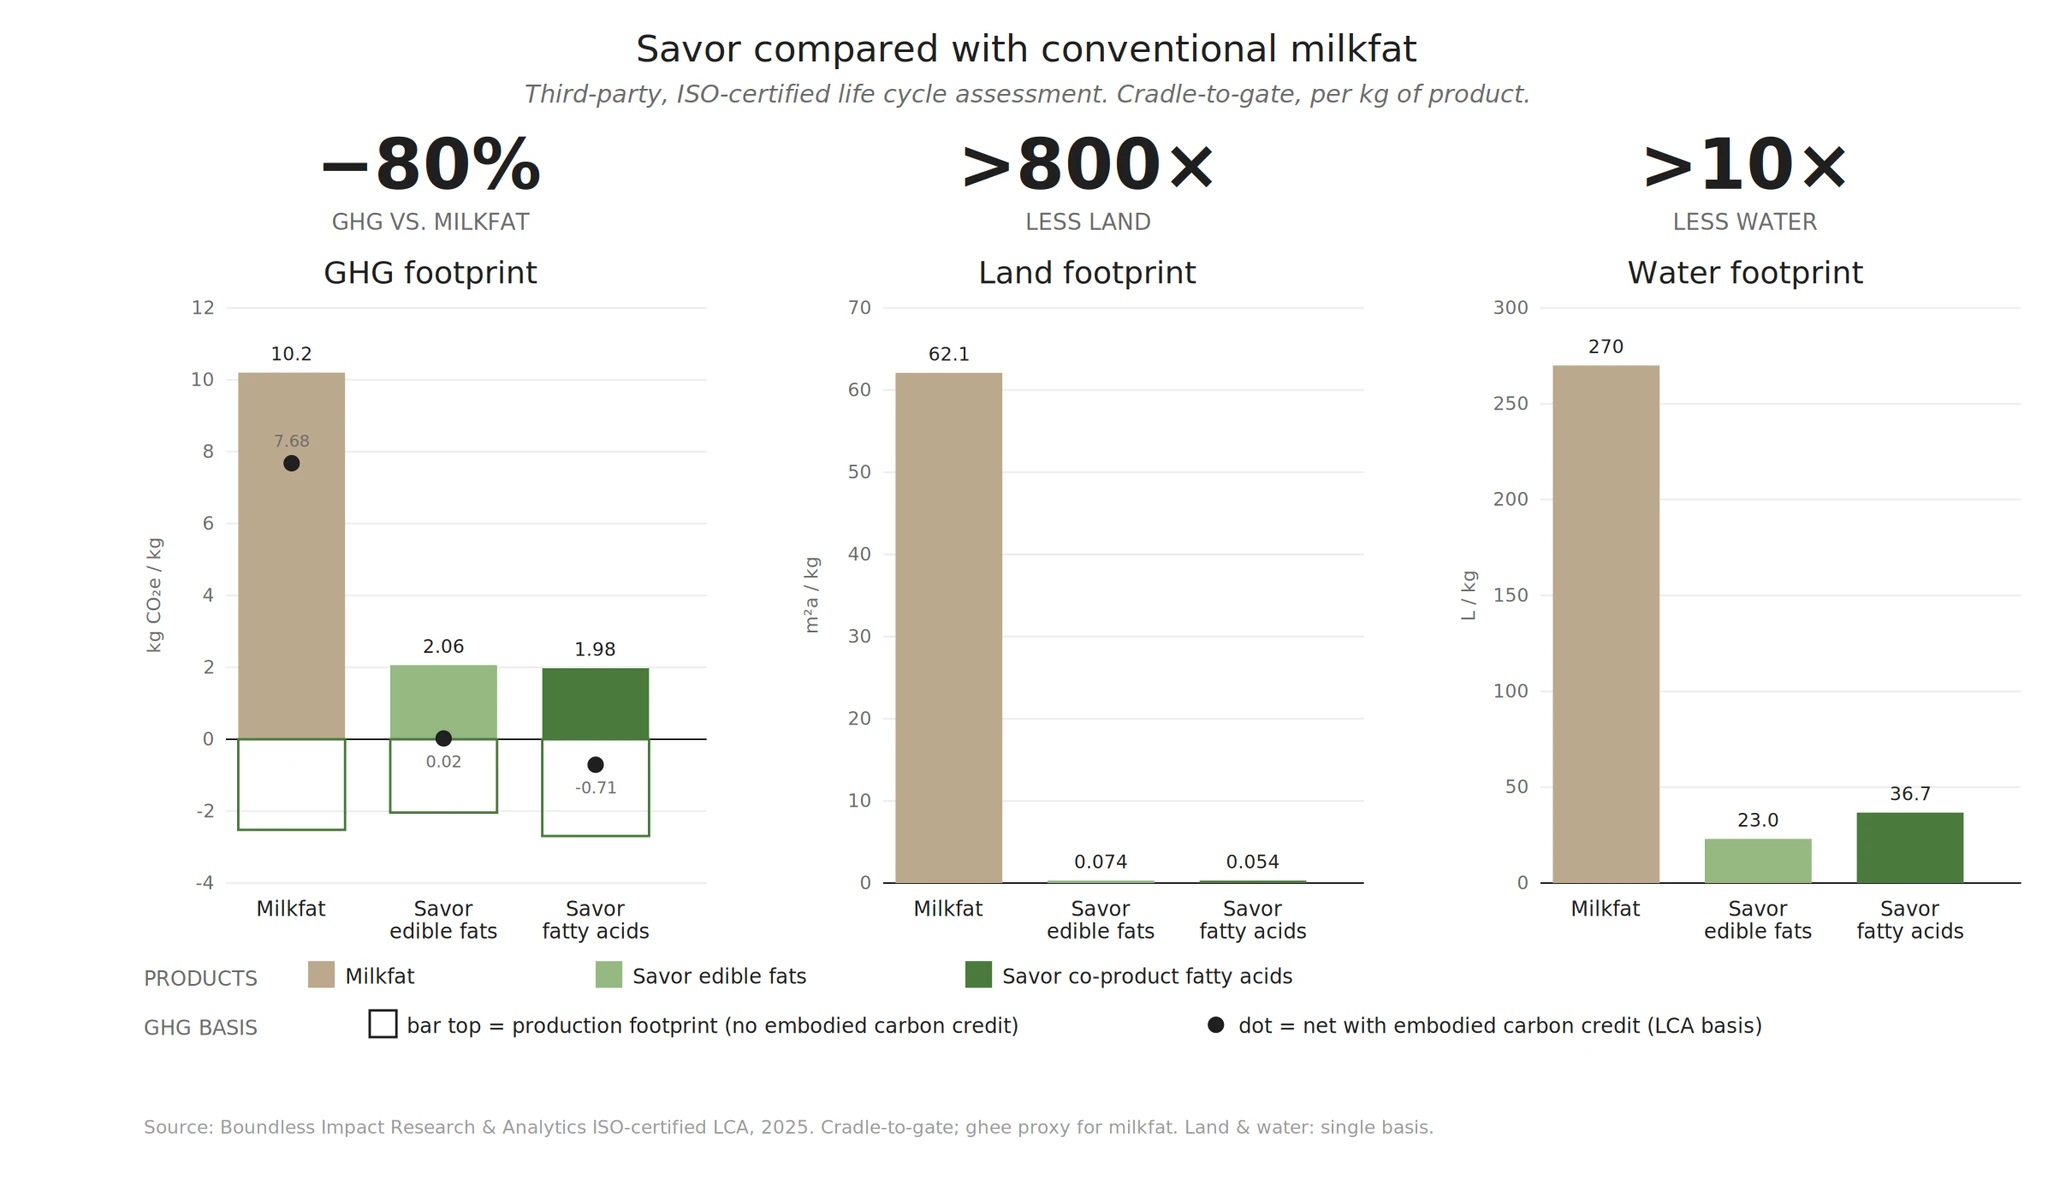
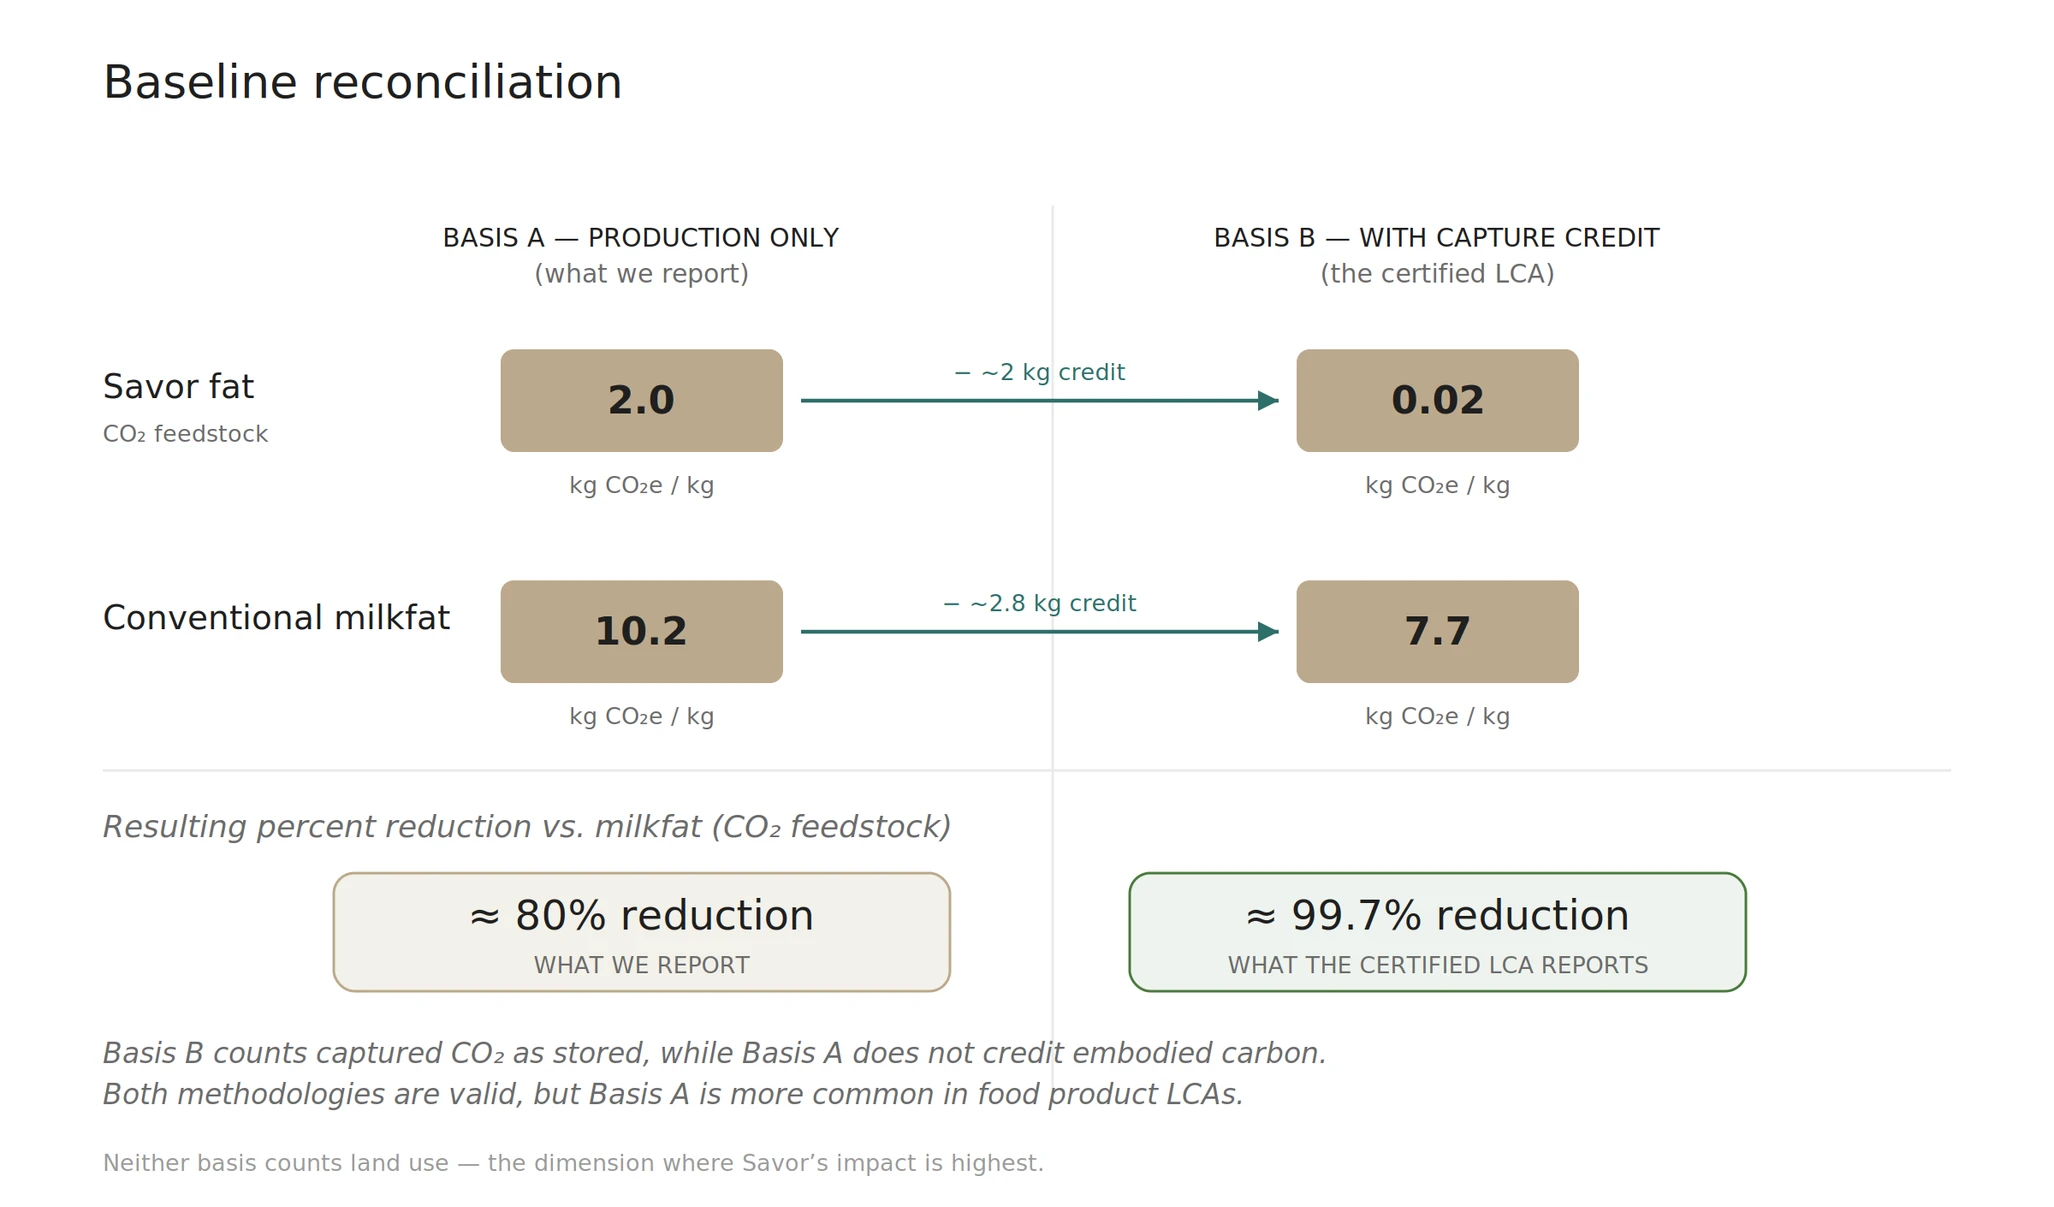
One important methodology note: in our carbon footprint comparison, we do not credit the CO₂ pulled out of the air as if it were permanent sequestration—that carbon is respired as CO₂ when the fat is used for energy in your body. This is a common methodology for food products, but our certified LCA happens to use a methodology that credits captured carbon embodied in a product. As such, the black data points overlaid on the bar chart in the GHG footprint graph above are the formally reported GHG footprint in our third-party LCA (i.e. 0.02 kg CO₂e per kg product, rather than 2.06). Using these data points, Savor’s CO2-derived milkfat has a carbon intensity that is more than 99% lower than dairy milkfat, rather than the 80% number we reported in the first section of this write-up. Both of these analyses are valid, as the difference is ultimately a methodology choice; the critical point is to ensure that whichever methodology is used, it is implemented consistently across all products being compared. The graphic below summarizes how these two baselines reconcile.
Getting into the weeds on Savor's footprint
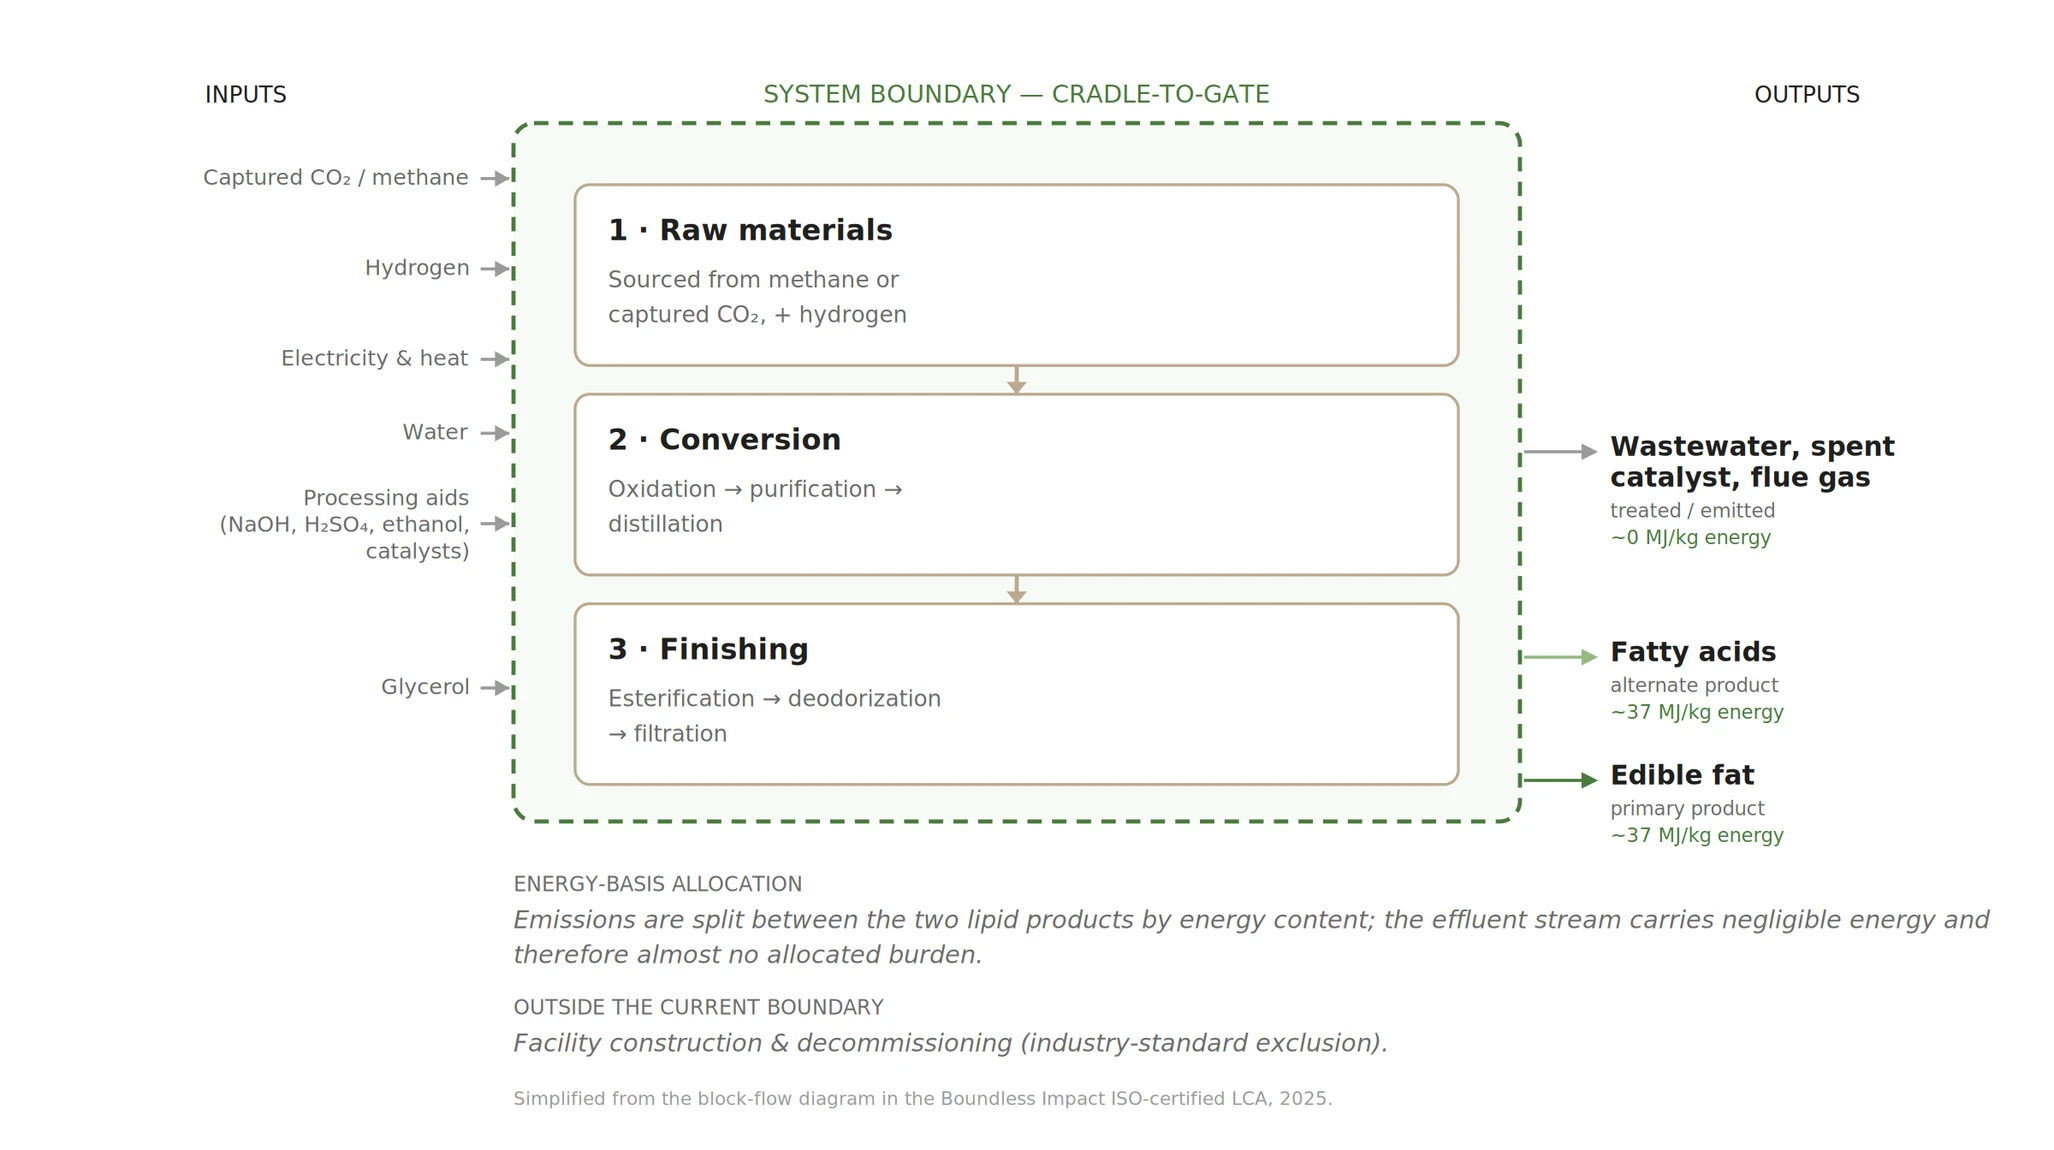
Above, we discussed the results of our third-party LCA. Here we'll look at how it was calculated. The first step in any LCA is to define the system boundary—the set of activities the analysis counts. This study uses a cradle-to-gate boundary, meaning it accounts for every incoming material and processing step from raw-material extraction up to the factory gate. Anything past the gate, such as transporting the finished product to a downstream customer, falls outside it. One other methodological choice worth noting: how emissions are divided among a process's multiple outputs, known as allocation. We allocate on an energy basis. The figure below summarizes both concepts.
With the methodology set, the next step is to define the base case — the specific scenario the model represents. We'd like to live in a world of absolutes, but in practice every field and factory has its own footprint, shaped by the particulars of its location: how much sun and rain a crop gets in a given year, what the local grid mix is for a factory, where raw materials are sourced. A comparative LCA adds one more choice—which product you're measuring against. Once the base case is fixed, a sensitivity analysis can test how much the results move when key assumptions change, such as crop yield or the carbon intensity of energy. For Savor's third-party LCA, the base case was a comparison against milkfat, using CO₂-derived inputs, assuming an average US grid.
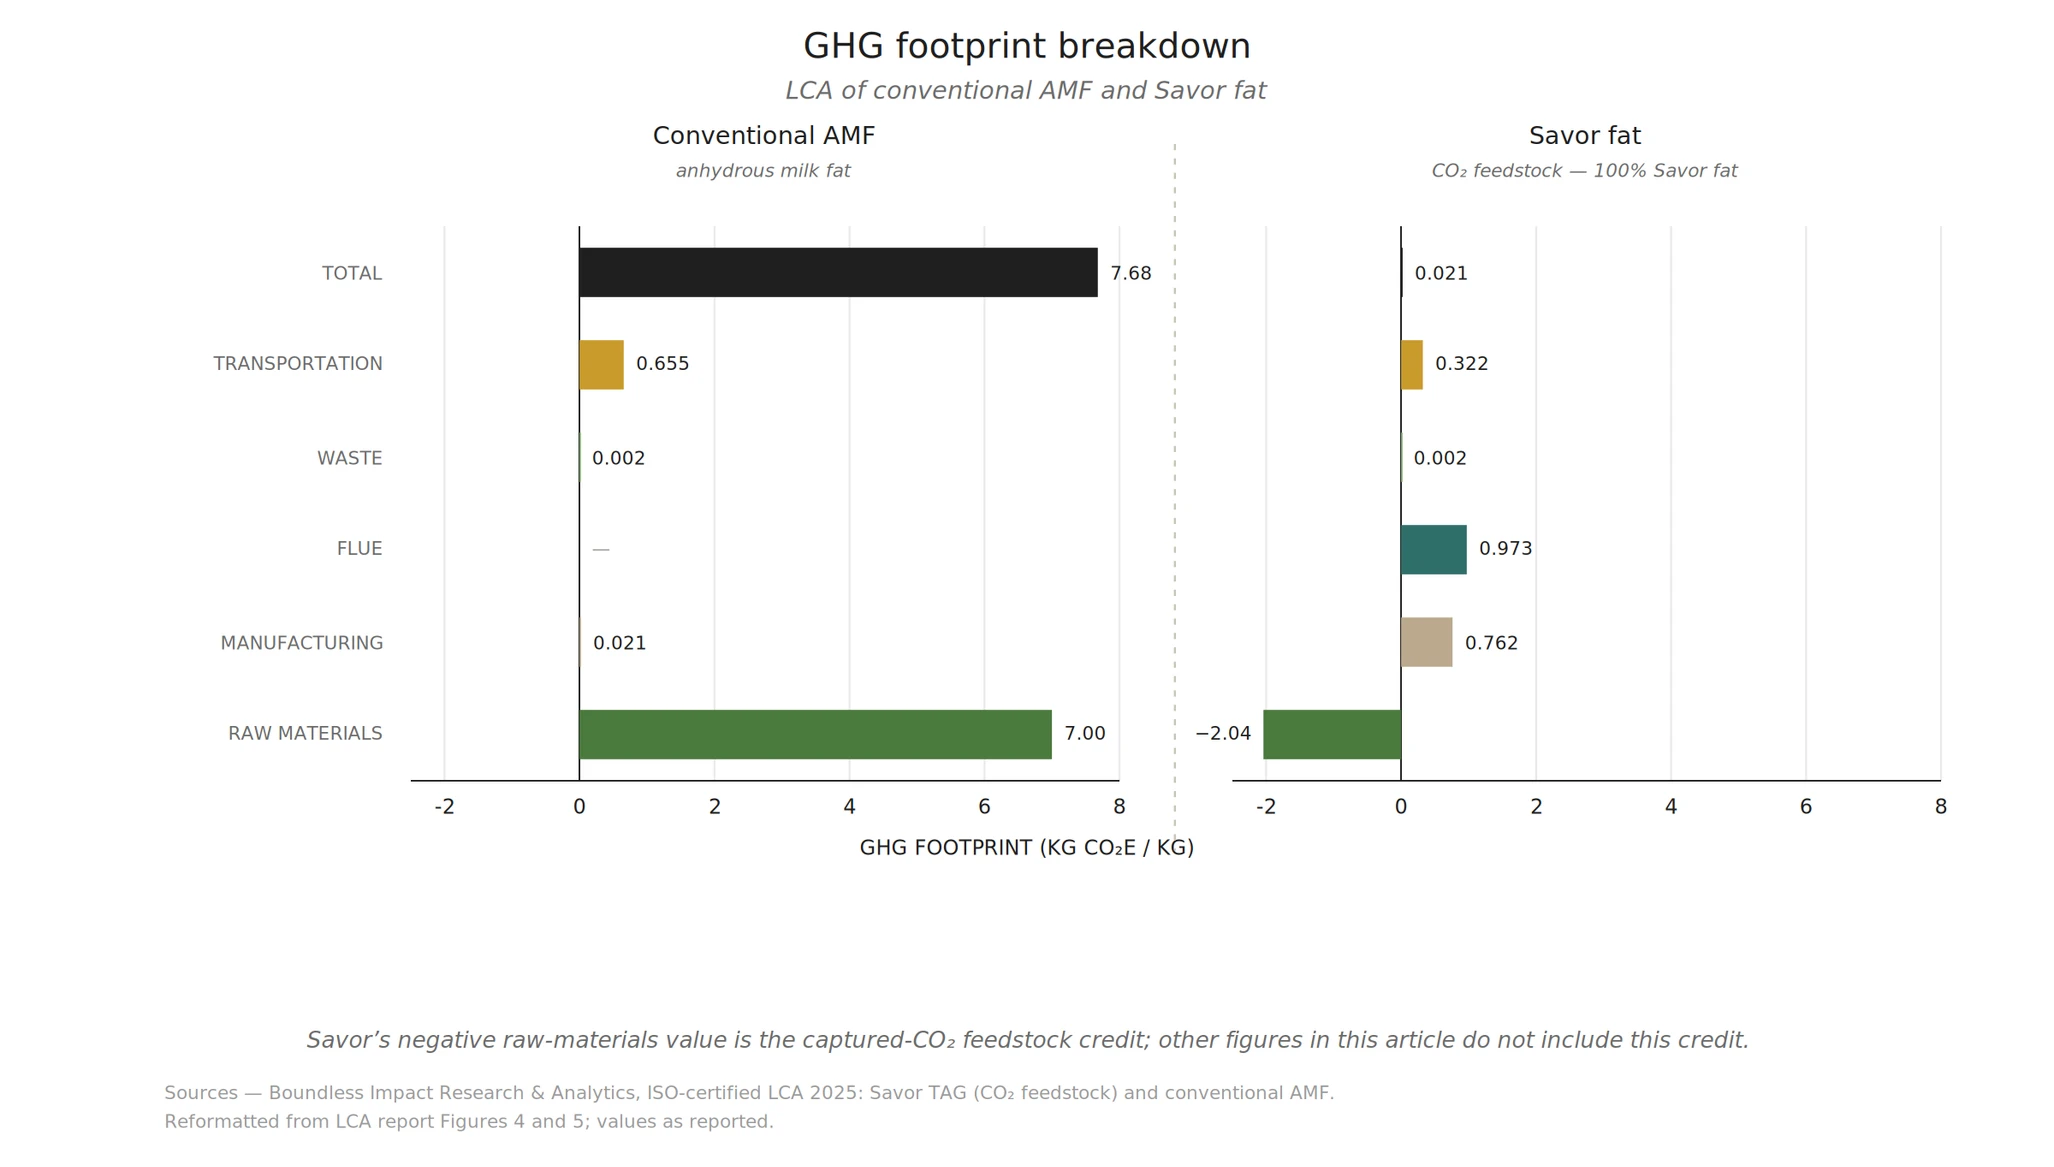
The chart below shows what contributes to the GHG footprint of each product in the LCA base case. For anhydrous milkfat (AMF), the LCA input is the carbon intensity of a ghee product, which appears almost entirely as a raw-material input, with a small transportation contribution. For Savor's process, the footprint is built from the energy intensity we've measured, multiplied by the base-case grid intensity, along with direct process emissions and raw material inputs. Because our primary feedstock is captured CO₂, it appears as a credit, i.e. the negative raw-materials bar.
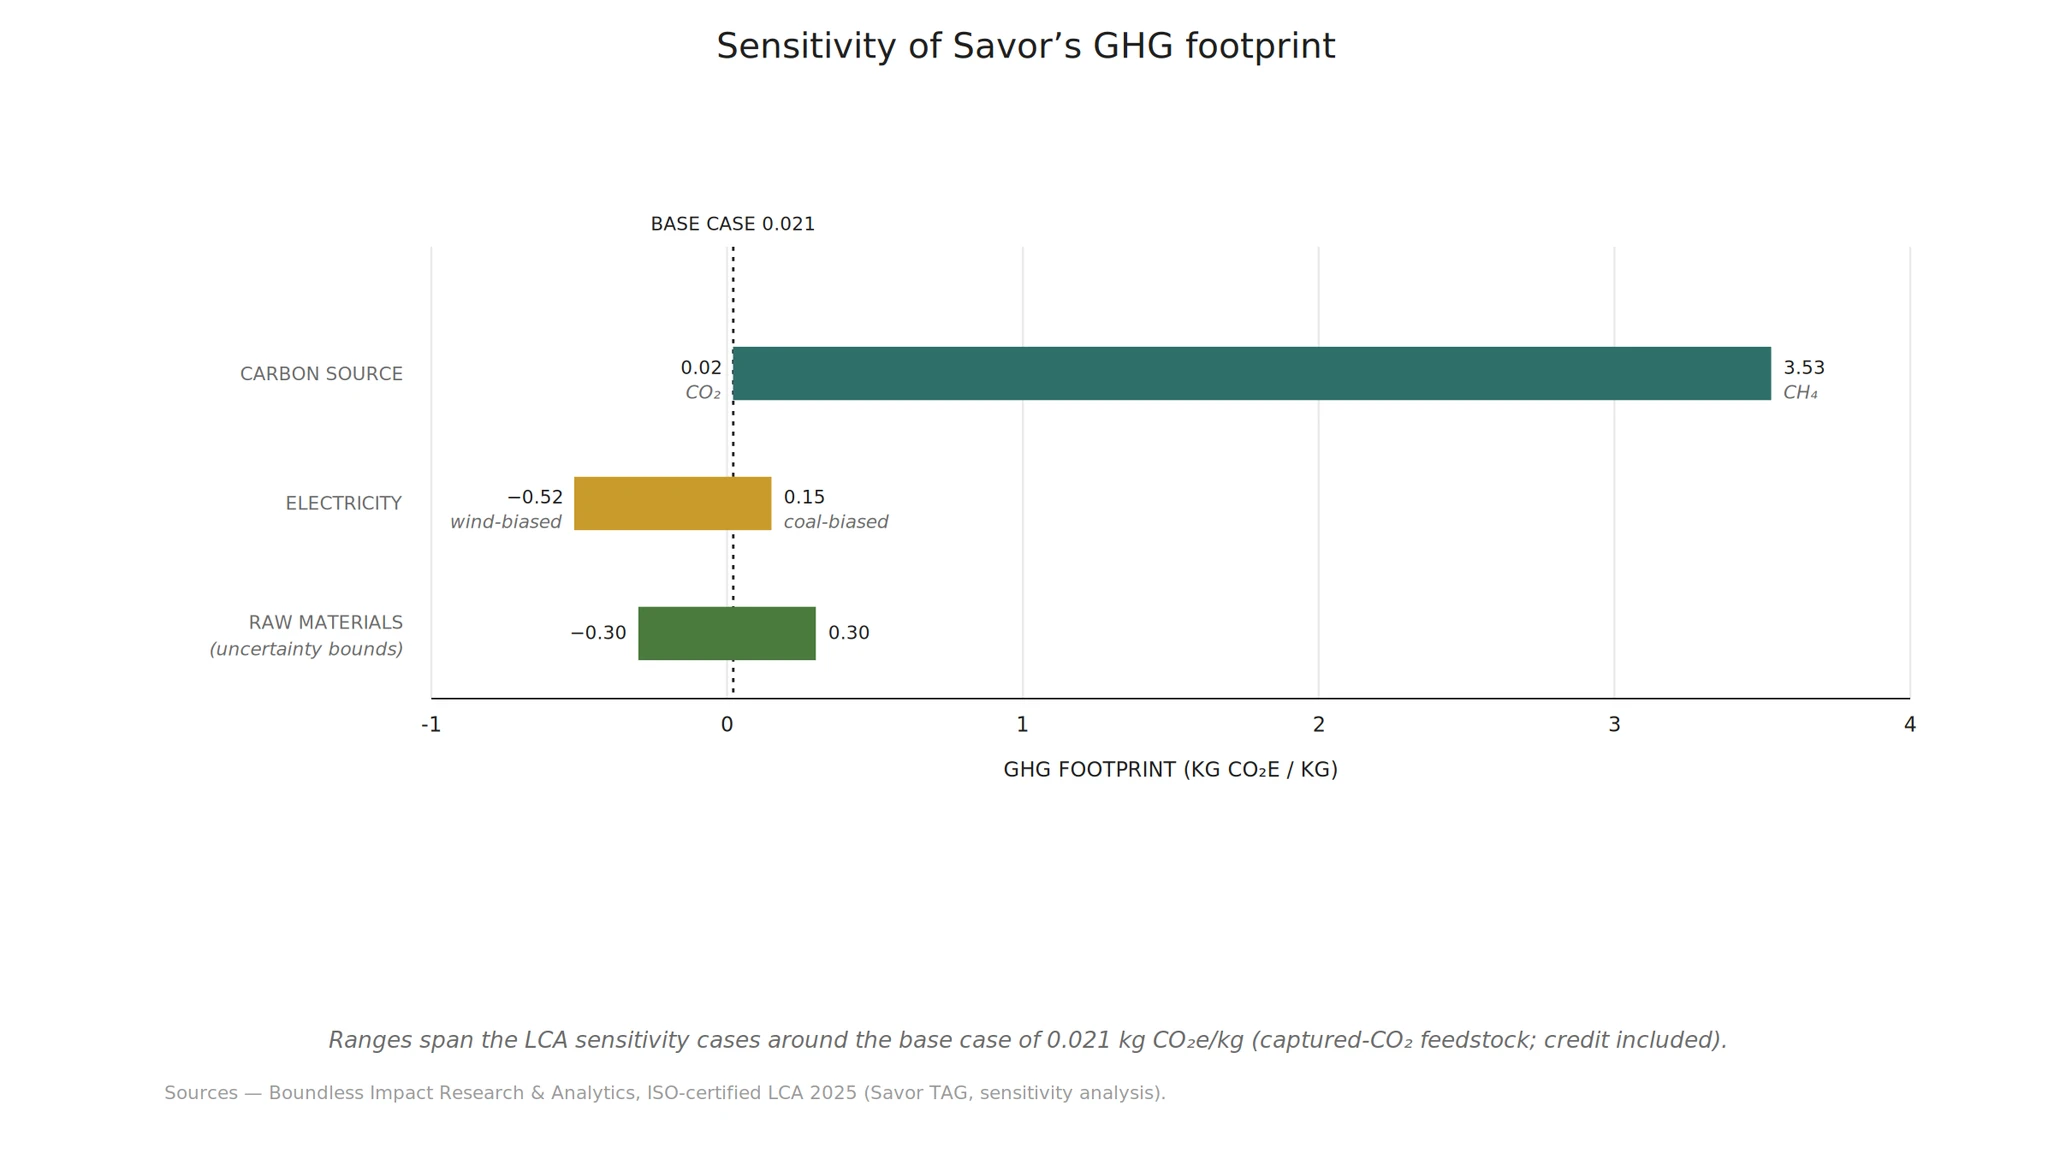
The sensitivity study considered three factors: the carbon source, other raw material inputs (processing aids), and grid intensity (electricity). The results are shown in the tornado chart below. While electricity and raw materials each have a measurable effect, the carbon source dominates sensitivity—impacting the footprint more than five times as much as any other factor.
Three years later: the models meet the data
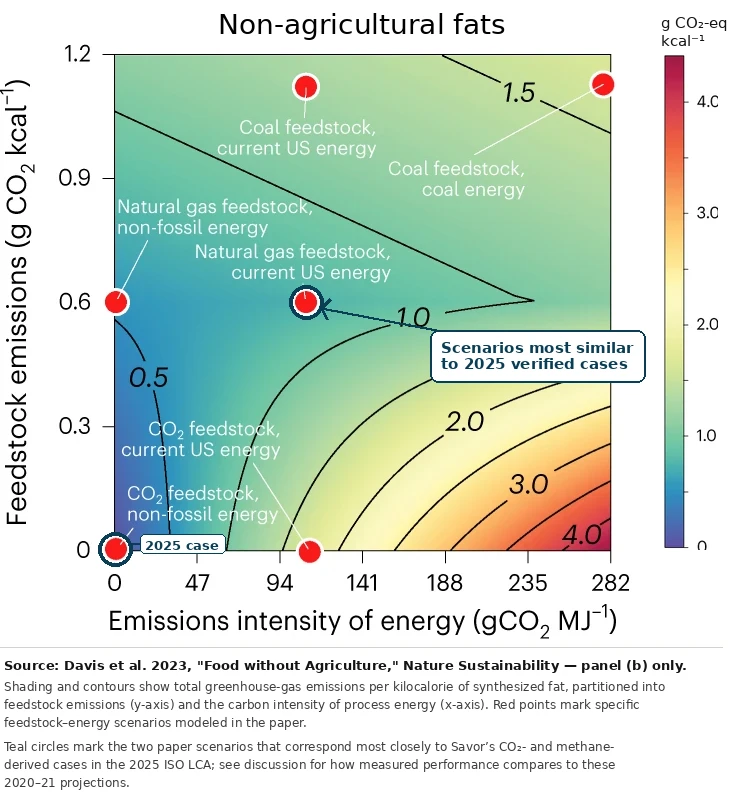
As mentioned above, we've been analyzing the carbon footprint of Savor's process since before we founded the company. We published some of this work more than two years ago in Food without Agriculture, which mapped the footprint of fats and oils made with a process like Savor's as a function of the carbon source, process energy required, and the carbon intensity of the electricity powering it. That map showed that non-agricultural fats made from CH₄ on the average US grid would come in under 7.2 kg CO₂e per kg (0.8 grams per calorie)—about half the roughly 13.5 kg CO₂e per kg (1.5 grams per calorie) for palm oil in Indonesia. At the time, those were projections: based on literature data and process models we built in 2021.
The figure below shows our previously published map, with two points highlighted—those corresponding most closely to our 2025 LCA, in which carbon is sourced from CO₂ and from CH₄. As discussed above, the third-party analysis reported a CO₂-derived footprint of about 2 kg CO₂e per kg (0.2 grams per calorie) and a CH₄-derived footprint of about 5.5 kg CO₂e per kg (0.61 grams per calorie); both figures exclude the embodied-carbon credit, consistent with our previous methodology. Both measured points land squarely within the scenario space we mapped—with slightly lower carbon intensity than predicted, because the process's measured energy intensity came in below what our models had assumed. Not all models survive an encounter with real-world data; in this case, the data confirmed we'd been pointed in the right direction from the start.
What’s next: from low-footprint to restoration
Now that we've dug through the details of how the LCA was built and its sensitivities, it's worth revisiting an earlier takeaway: Savor's 50–98% emissions-reduction opportunity depends on land use. The full impact isn't realized unless the transition either prevents future deforestation or actively restores native ecosystems to their full carbon potential. That topic deserves a full treatment of its own, but it's worth sketching here at a high level.
Because Savor's fats free up the land that conventional production would have required, that land becomes available for something else—and the most valuable something else, in carbon terms, is often restoration. A product that occupies almost no land doesn't just avoid emissions; it can create room for carbon to be pulled back down. That turns a low-footprint product into a potentially net-positive one, where the same production that displaces land-intensive fats and oils also underwrites the restoration of the land it no longer needs.
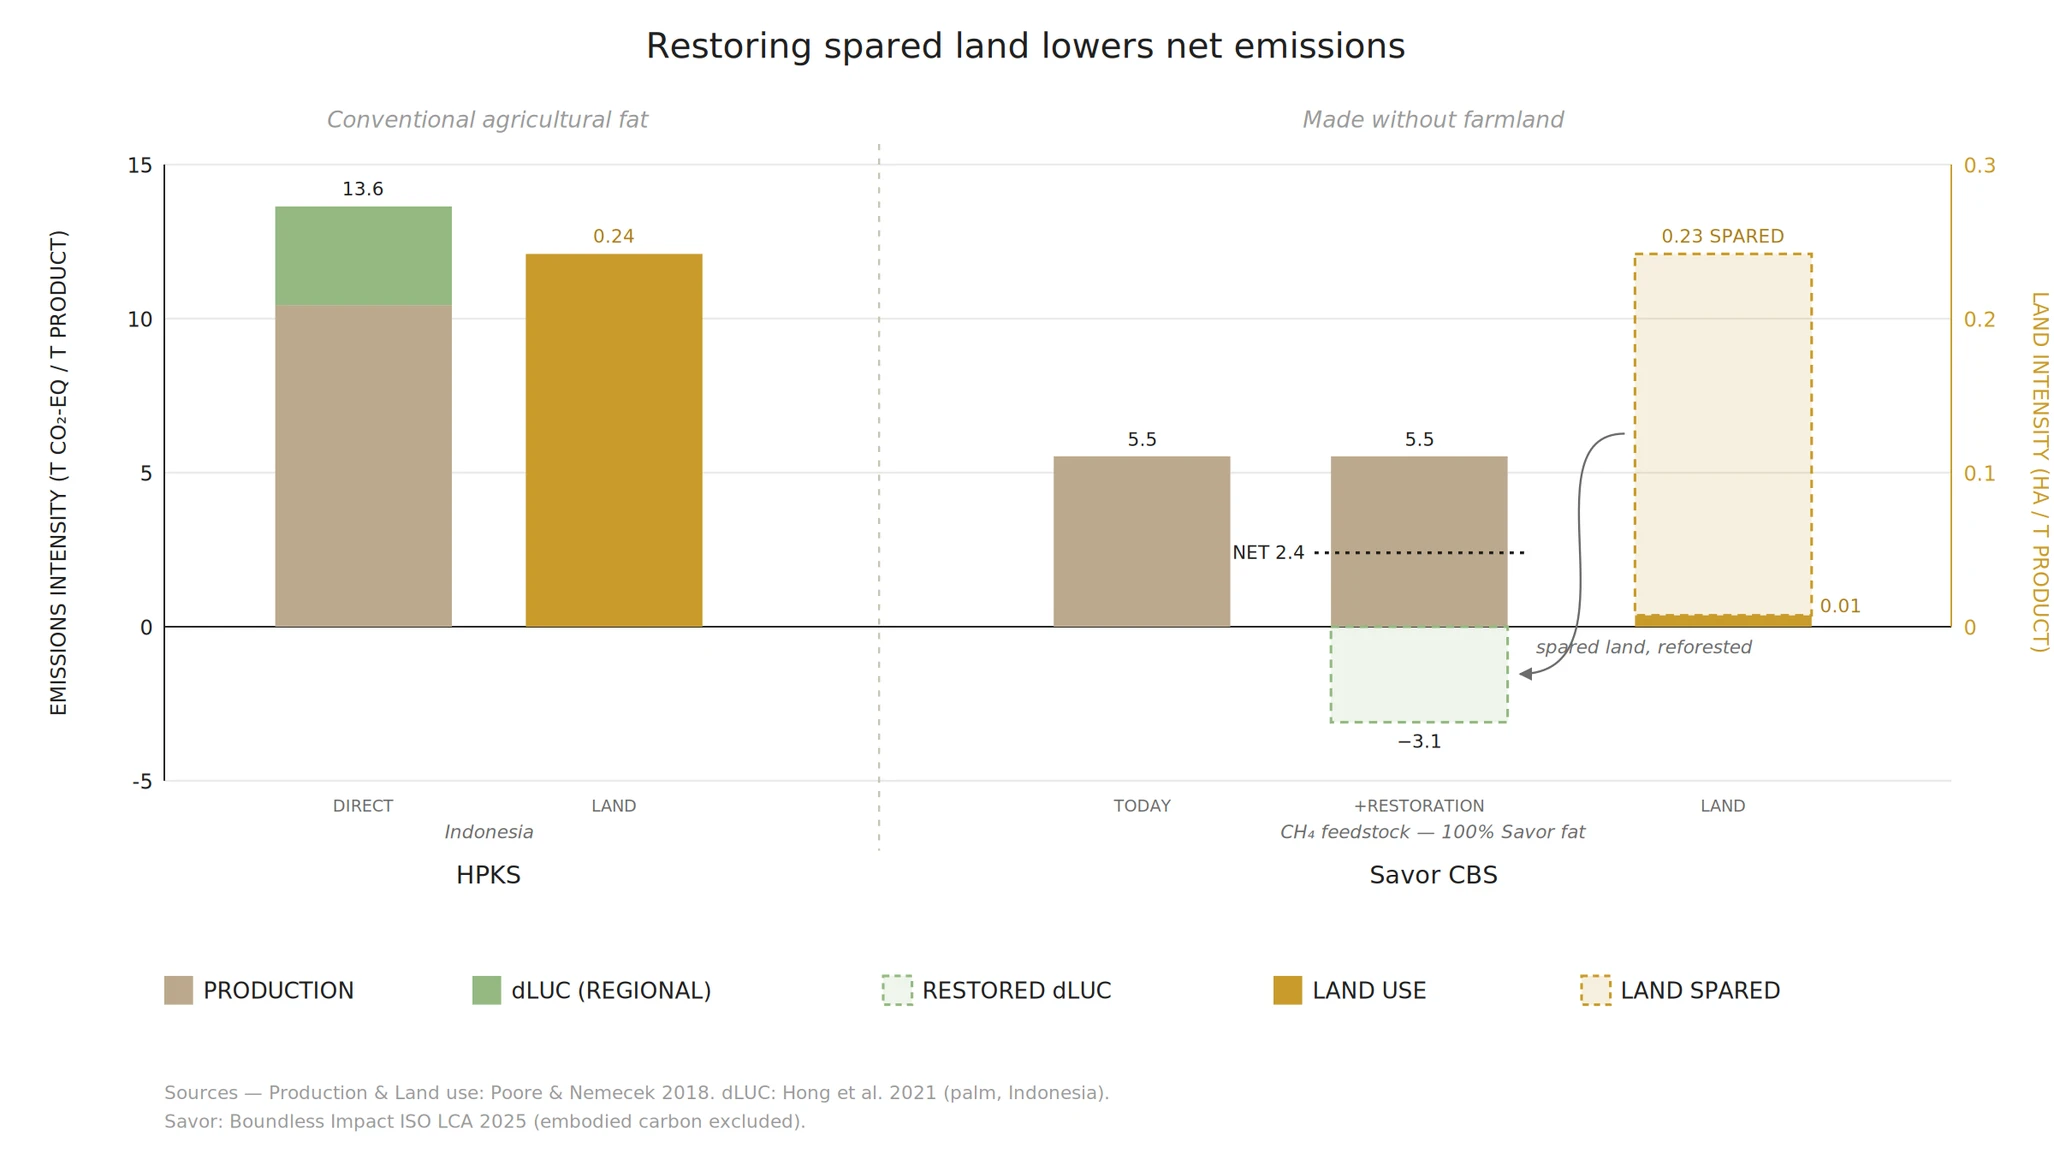
The scale of that restoration opportunity is quantifiable—but it must be mapped to the specific agricultural product Savor replaces. A Savor milkfat alternative carries a different land, ecosystem, and carbon opportunity than a palm oil alternative or a cocoa butter equivalent. The figure below shows this analysis for one product: our cocoa butter substitute (CBS), which replaces a palm-kernel-derived fat (HPKS). Each ton of Savor CBS spares 0.23 hectares of land in palm-growing geographies—land that can be restored, with a carbon opportunity set by the ecosystems native to those regions. In the case shown, reforesting that land takes the net footprint from 5.5 to 2.4 kg CO₂e per kg (about the same as a Savor fat sourced from CO2 instead of CH4).
We're actively developing our workstreams on this front—the partnerships, the accounting, the mechanism by which restoration gets funded and credited. Stay tuned for our next installment.
Where this leaves us
We spent our first piece making the case that our old carbon accounting was broken because it left land out, and that, once included, we’d want to optimize for a very specific kind of food production: high-yield, low-land, off the ecologically valuable map. This piece is what it looks like when a company built for exactly that world turns this accounting on itself.
The answer: across every major category, Savor’s process cuts the climate footprint of fats and oils by roughly half to nearly all—and the advantage is largest where land matters most. We've measured our process, and independent verification confirms both the impact available today and where the most powerful opportunities lie as we scale and the grid decarbonizes.
What’s next is a look at how we can change our relationship with the land now that the accounting to value it is in place.
Nearly everywhere on Earth is still someone’s habitat. The exception now coming into view is off-world production—somewhere like the Moon, which, to our knowledge, has never been home to any life form.